


Data through August 17, 2026. Cancer patients only.
We use two main types of measures:
- PROMIS symptom scores – validated questionnaires commonly used in medicine to measure how much symptoms like pain or anxiety are affecting someone’s life.
- Patient Important Outcomes (PIOs) – the everyday activities that matter most to patients, such as walking, working, socializing, or managing disease-specific symptoms.
By following patients over time, we can see what percentage experience meaningful improvement, how large those changes are, and how often they need emergency or hospital care. These are observational, real-world data, not results from a randomized clinical trial, but they offer an important window into how guided cannabis care can support symptom management in routine practice.
The sections below summarize these outcomes for EO’s cancer patients, overall and by age and baseline symptom severity.
PROMIS Metrics
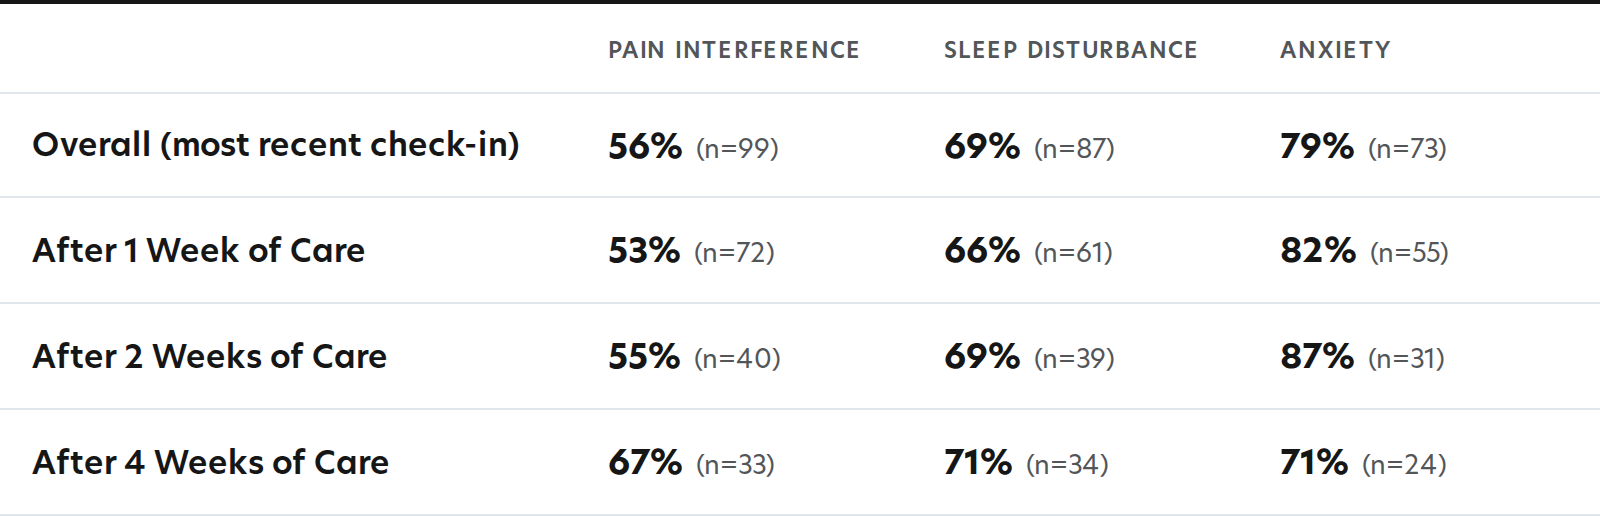
This table summarizes how quickly and effectively patients in our program experienced meaningful relief from their symptoms when using guided cannabis care. We use PROMIS questionnaires, a set of validated tools commonly used in medicine, to track changes in pain interference, sleep disturbance, and anxiety.
The percentages show the share of patients who had a clinically meaningful improvement in their PROMIS score from baseline (at least a 3-point reduction) after 1, 2, and 4 weeks of care. The top row shows each patient’s most recent check-in. The sample size for each symptom at each time point is shown in parentheses.
PROMIS Metrics - Under 50 vs Over 50
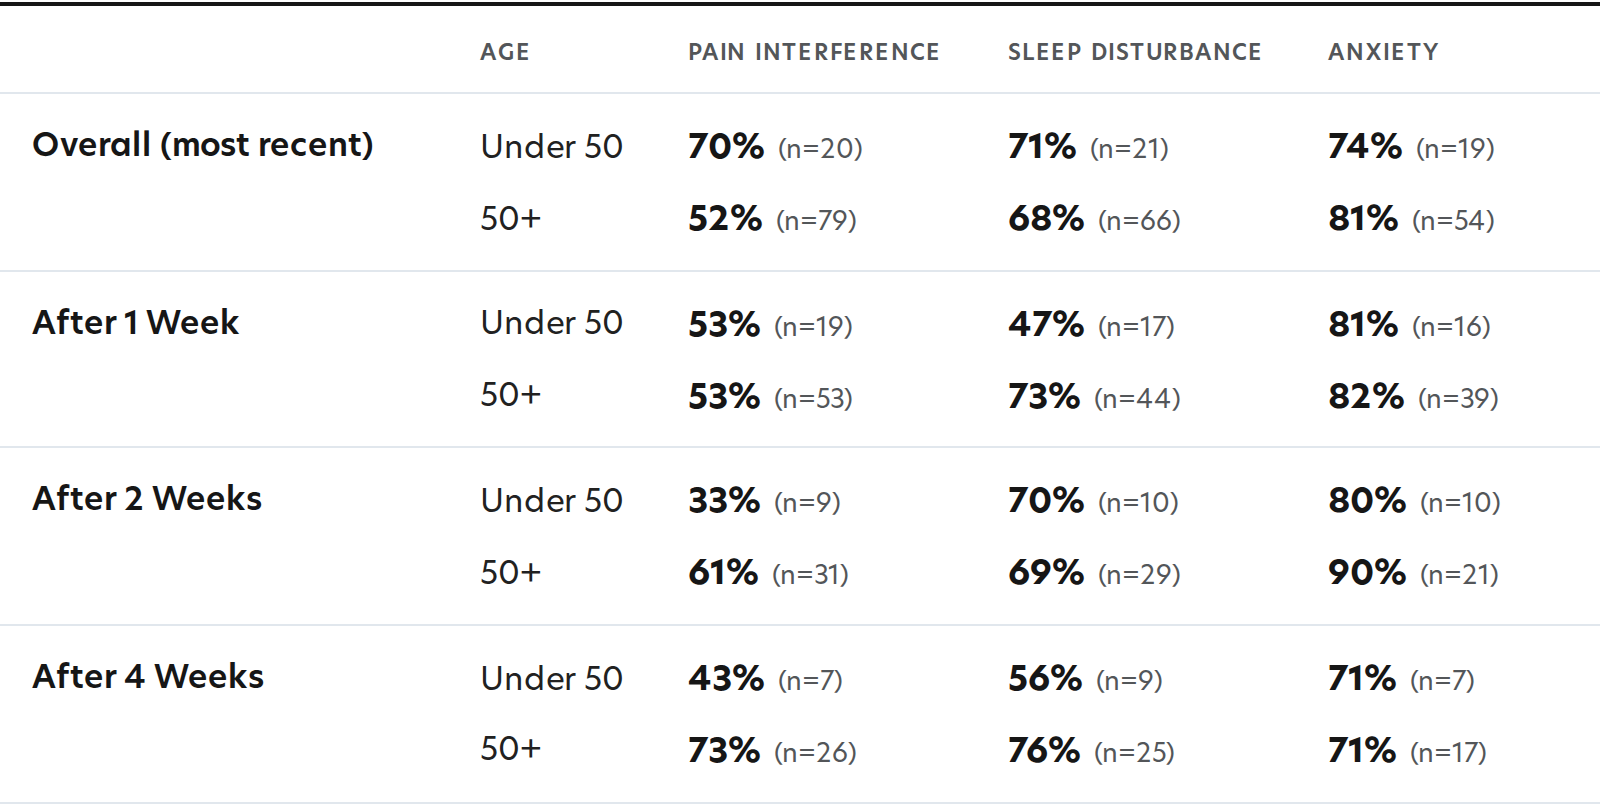
Because younger and older adults can respond differently to treatments, we looked at PROMIS improvements by age group. This table compares patients under 50 and 50 and older to see whether guided cannabis care works differently across ages.
For each symptom, the percentages show the proportion of patients in each age group who achieved a meaningful improvement (at least a 3-point reduction in their PROMIS score) after 1, 2, and 4 weeks of care. Overall, both younger and older adults in our program showed meaningful improvements.
PROMIS Metrics - By Baseline Symptom Severity
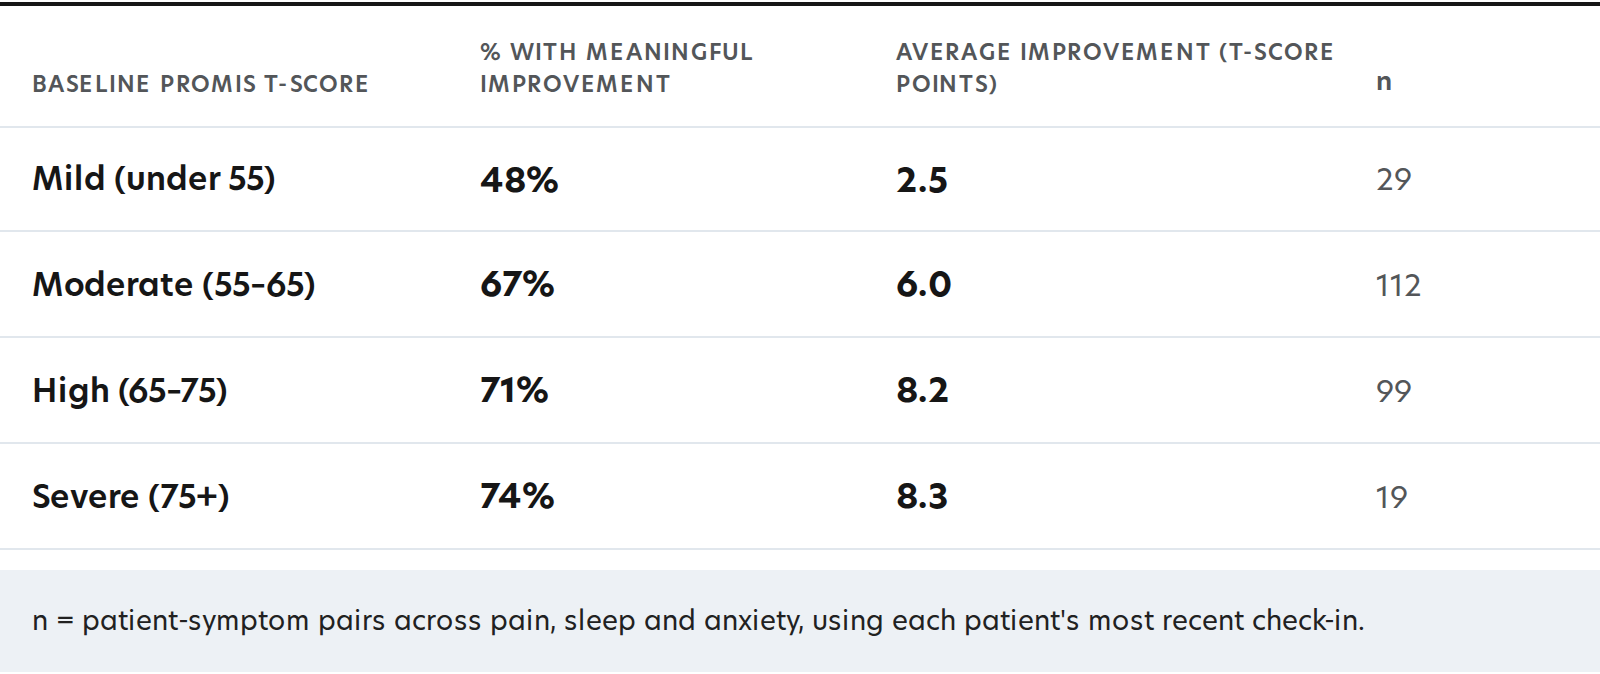
Patients who start with the heaviest symptom burden improve the most. Among cancer patients with severe baseline scores, 74% reached meaningful improvement, compared with 48% of those with mild baseline scores.
PIO Outcomes
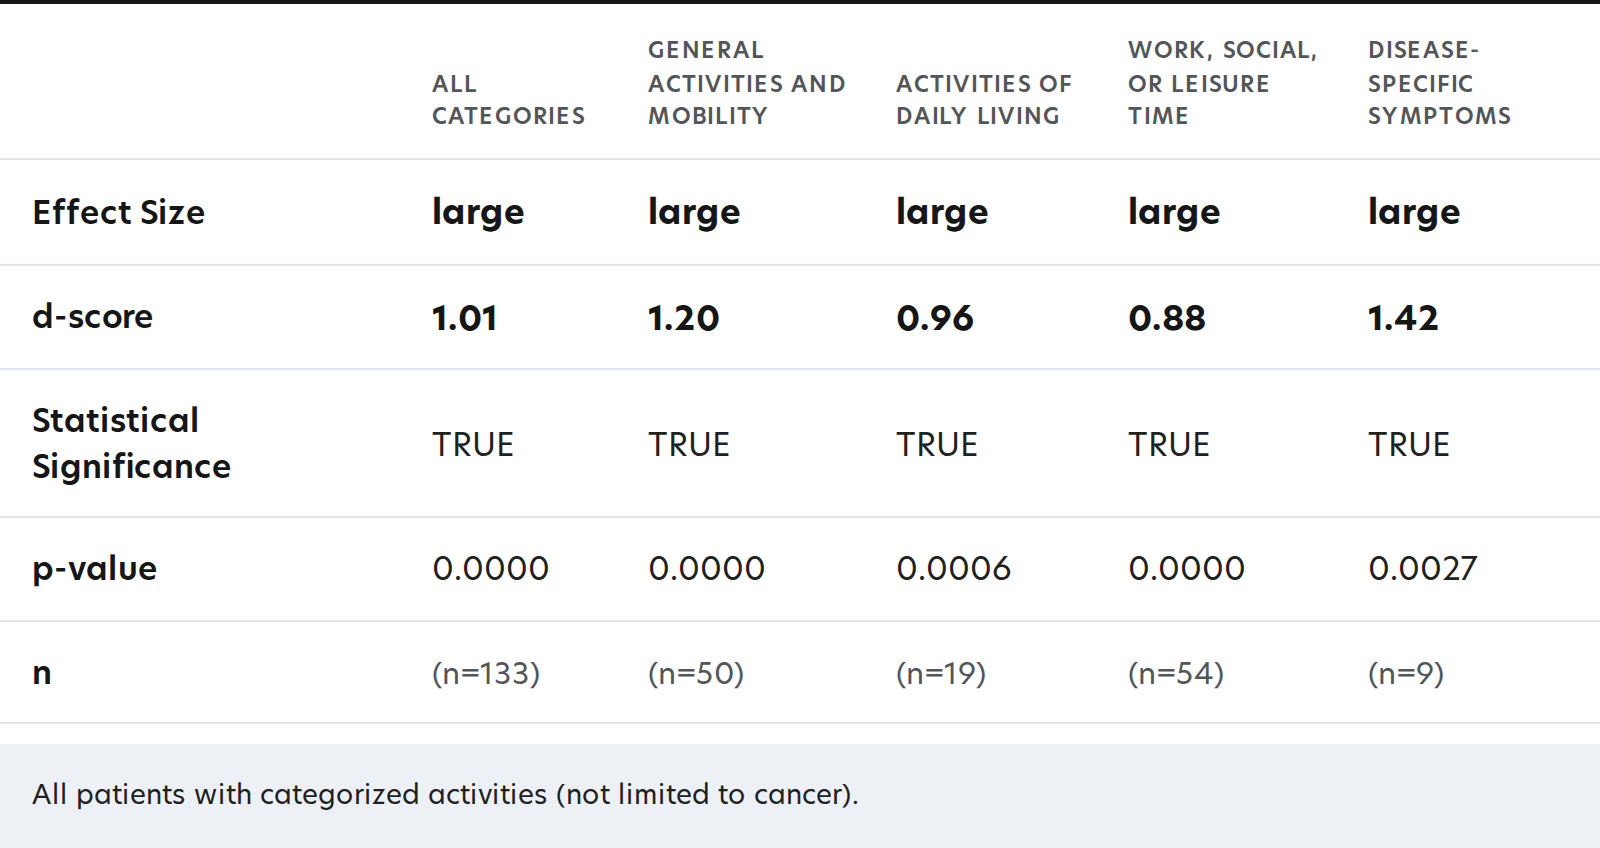
PROMIS scores tell us about symptom severity, but we also want to know whether people can get back to the activities that matter most to them. Patient Important Outcomes (PIOs) are real-world activities such as walking, working, socializing, or managing disease-specific symptoms.
This table reports effect sizes (Cohen’s d) for changes in difficulty with these activities after starting guided cannabis care, for all patients with categorized activities. Across all categories, the effect sizes are in the “large” range and statistically significant (p < 0.05), indicating that patients were meaningfully more able to do the activities that are important to their daily lives.
ER Visits & Hospitalizations
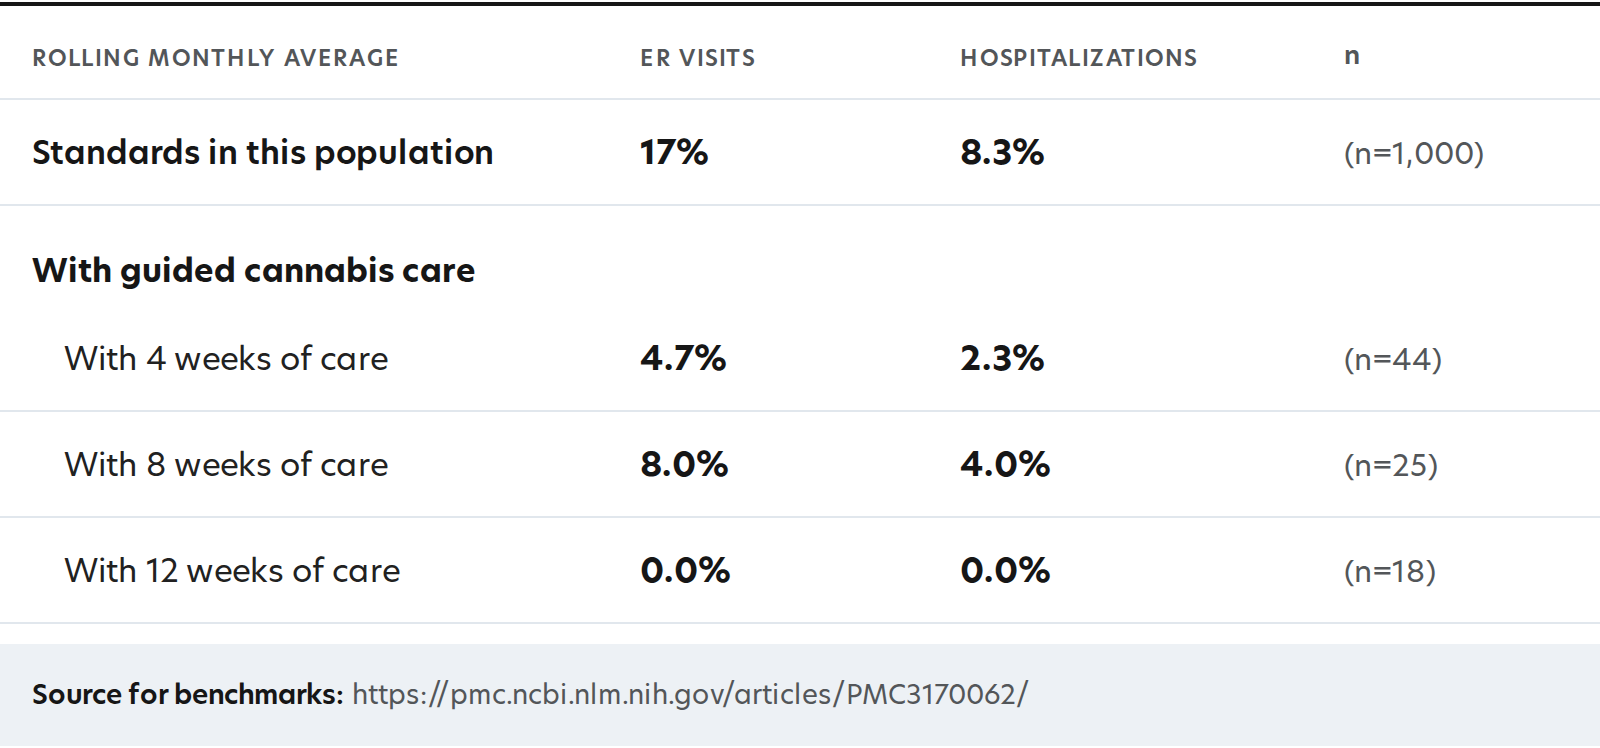
To understand how symptom management may relate to healthcare use, we compared published benchmark rates of monthly ER visits and unplanned hospitalizations in similar cancer populations to the rates seen among patients in our guided cannabis care program.
The “Standards in this population” row shows benchmark rates from the literature, while the “With guided cannabis care” row shows the rolling monthly average for our patients after about 4 weeks of care. These data are descriptive and do not prove cause and effect, but they suggest that patients in our program had lower rates of ER visits and hospitalizations during the first month of use.
Methodology
PROMIS Metrics: We defined a meaningful improvement as a 3-point or greater reduction in a patient’s PROMIS T-score between baseline and follow-up. The percentages in the tables show the share of patients who reached this threshold. Time points: 1 week = a check-in on days 0–10 of the care plan; 2 weeks = days 11–21; 4 weeks = days 22–42. If a patient has more than one check-in in a window, we use the one closest to day 7, 14 or 28. “Overall” uses each patient’s most recent check-in.
Cancer Patients: Cancer patients are those with a cancer diagnosis, a logged cancer treatment, or cancer-related symptoms at intake.
Baseline Severity: Baseline severity uses the intake PROMIS T-score: mild under 55, moderate 55–65, high 65–75, severe 75 and above.
PIO Outcomes: PIO effect sizes were calculated using a paired Cohen’s d test comparing baseline to follow-up difficulty ratings. Follow-up is the average of each activity’s check-in ratings. Activities rated below 3 at baseline are excluded. Effect sizes are categorized as no effect (d < 0.2), small (d ≥ 0.2), medium (d ≥ 0.5), or large (d ≥ 0.8). Larger values indicate more meaningful improvement. Statistical significance was set at p = 0.05.
ER Visit & Hospitalization Benchmarks: Benchmark rates for ER visits and unplanned hospitalizations were drawn from published data in comparable cancer populations (source: PMC3170062).
Data through August 17, 2026. Test accounts excluded.


.png)